Customer Profiling Information
- Customer Profiling Overview
- Benefits of Customer Profiling
- Applying Customer Profiles
- Consumer Surveys & Research
Related Topics
Resources
Applying Customer Profiles
Indexes and Penetration Provide Actionable Information
Index and Penetration are two key elements of customer profiling and segmentation services from Mapping Analytics. We use indexes and penetration rates to help you discover market opportunity — where you can find more customers like your best customers.
- Indexes and penetration rates provide the kind of actionable information you need to improve target marketing and site selection
Indexes Identify Customer Segments Likely to Purchase From You
Creating an index is a statistical process. An index compares how a group of people, such as your customers or the population of a given market geography, rate against a norm in terms of their expected behavior.
An index of 100 means the group (your customers, for example) will behave the same as the norm it is being compared against. An index over 100 means the group is more likely to behave in a specific behavior, such as purchasing your products; less than 100 and it is less likely.
Penetration Shows Where Potential New Customers Are
Penetration refers to how many customers you have in a given cluster, or customer profile, compared to the total size of the group. For example, you may have 5,000 customers in a trade area who fit profile A, which happens to represent your best customers, yet this trade area has a total of 100,000 people fitting profile A. In this case your penetration rate is 5% (5,000 is 5% of 100,000) — and there may be additional opportunity for you in this market.
Next Steps
- Download the Consumer Perspectives brochure to learn about our packaged analytic service to profile and segment your customers
- Contact us for a sample Customer Profiling report
Consumer Perspectives Brochure
A packaged analytic service to profile and segment your customer base.
Detailed Customer Profile Report
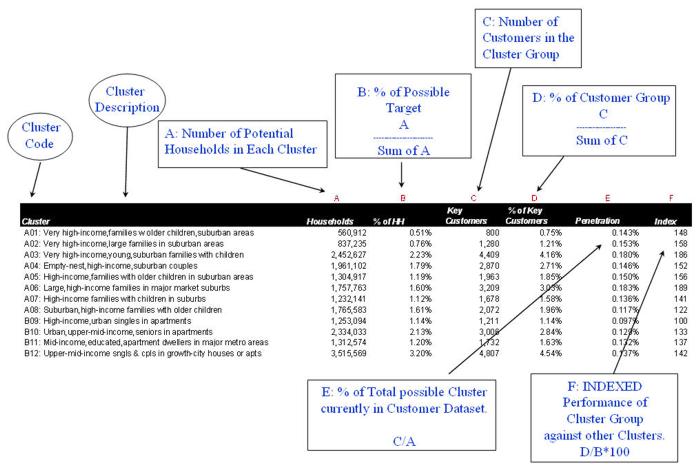
Detailed report shows customers in each cluster, penetration rate, and index. View Report
White Paper
Customer Segmentation Fundamentals
Discover the six steps to creating customer segmentation profiles and using them to gain marketing advantage.
Download
Achieving Return on Investment
"Gains graph" shows where to concentrate marketing and selling efforts. View chart